Learning how to generate the Mandelbrot set, I came across the definition of the "escape condition" which is the one that decides the color that is applied to each point of the plane where the Mandelbrot set is being calculated. This is a mirror of the question at MSE about the observation I did below.
I tried to use that "escape condition" concept in a test regarding the fractional part of sqrt(n), f(n)=sqrt(n)−trunc(sqrt(n)) truncated to 7 decimals. The algorithm finds for all f(n) the first occurrence of a specific value k={0,1,2,3,4,5,6,7,8,9} in the decimals of f(n). For instance 0.0123456 has its first decimal value k=0 in position 1, in other hand 0.1230320 has its first decimal value k=0 in position 4. If it is not found, the escape value will be the maximum possible value, 8. As in the Mandelbrot set depending of the escape value, a different color will be used.
A) First I have organized the natural numbers in the positions a_xy of a plane as follows:
a_n0=n^2
a_n1=(n^2)+1
a_n2=(n^2)+2
a_n3=(n^2)+3
...
a_ni=(n^2)+i
while i<n
In the first file there are squares, in the second squares + 1, in the third squares +2, etc. while the values are less than the next square:
B) Then each element a_ni is replaced by f(a_ni)=sqrt(a_ni)−trunc(a_ni), truncating up to 7 decimals.
C) Finally, for all f(a_ni) now it is possible to find the first occurrence of for instance k=0 in f(a_ni). It is found starting from the upper decimal value. The position where it is found is the "escape position", and each position will have its own color.
This is the plotting of colors of each escape position for the algorithm when looking for the first occurrences of k=0 in f(a_ni):

Same exercise for the first occurrences of k=1:

They are very similar, but they are not the same. It seems that there are star-like patterns acting like local "attractors" (please excuse me if I abuse of the terminology).
This is an animated image with the same graph when looking for the first k=0, then k=1... up to the first k=9. Same color in the animation means that the first occurrence of k is in a same specific position. It is reduced to fit the screen, when clicking in the image it is possible to see it correctly:

When looking to the animation, it seems that the first occurrences of each type of k are "rotating" around the "local attractors". E.g. at column n=500 is easy to observe the rotation.
It seems that there is a symmetry in the background between the upper side and the lower side of the bisection of the triangle that has (0,0) as the bisection vertex. The direction of the "rotation" explained above is inverted between both sides of the bisection (the upper part "rotates" to the right, and the lower part to the left), but the mapping of colors in both sides seem to be initially the same one.
I have plotted the images with a gray scale gradient, so now it is possible to see more details of the above rotating picture:

The following animation is the search of the position of the first decimal value k=0 in the fractional digits obtained by applying the functions f(n)=n^t−trunc(n^t), where t belongs to the interval [0.49995..0.50006] and each frame is increasing by 0.00001. The pattern "bends" in XY and the background star-like patterns are relocated depending on the slight changes of t.
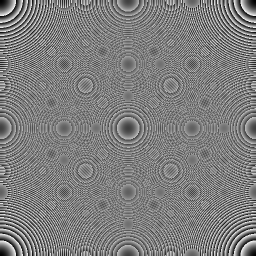
 Finally, as +XY is symmetric in −XY this is how it looks like the complete picture, without the restriction regarding the values being less than the next square, so it fills the XY plane completely:
This is what I have found so far, there is a comment at my MSE question that explained that these patterns are multifractals, and there is a page with similar star-like patterns appearing in the representation of modular arithmetic products. That is quite interesting, because initially my graphs are not directly related with modular arithmetic, but if the same patterns arise, then there could be a link between modular arithmetic and the first occurrence of a specific digit in the fractional part of sqrt(n).
UPDATE: it seems that my algorithm is producing Moiré patterns. I did the same test using the fractional part of n/m and a similar pattern appears. Using the color code in the first graphs should avoid that effect, indeed the pattern is there independently of the zoom (so it would not be Moiré if I can see the pattern independently of the zoom) but in the case of the polar coordinates, it seems too similar to this. Maybe the examples of the modular arithmetic website are also Moiré patterns, the circular examples in the site look exactly like this.
Once I found the relationship with the Moiré patterns, just found at MSE a question about the same topic, so somehow the algorithm I did and the modular arithmetic calculations both seem to generate Moiré patterns.

