As the brilliant and wise professor William Thurston said: "Mathematics is an art of human understanding. … Our brains are
complicated devices, with many specialized modules working behind the scenes
to give us an integrated understanding of the world. Mathematical concepts
are abstract, so it ends up that there are many different ways they can sit in
our brains. A given mathematical concept might be primarily a symbolic
equation, a picture, a rhythmic pattern, a short movie — or best of all, an
integrated combination of several different representations."
In the case of the following test, the concepts are pictures and movies. As in my former post regarding the patterns that can be found in the roots of quadratic and cubic equations, I wanted to know if there are patterns hidden in the complex division, and it seems I found some interesting too!
Indeed, reviewing the results of my former post, and thanks to the kind insights from the administrator of the Number Theory group in LinkedIn, it seems that they look like the patterns of the refraction of some type of quasicrystal structures. Are they related? I do not know, but so far here is what I have found:
1. First this is the description of the test: the images are showing the set S of complex numbers a+bi represented in the Cartesian plane (a=x, b=y) obtained from the divisions of the complex numbers: z1/z2 , where z1 = (A+Ai) and z2 = (B+Bi) being A and B natural numbers both of the interval [-41..41]. The set S contains all the possible combinations of divisions between z1 and z2 in those intervals (except when z2=0+0i which is not represented). Then a zoom is applied to show only a zoomed part of the whole pattern.
2. As the intervals used for the test are the same ones, A = B = [-41..41], this is the original lattice or mesh of complex numbers that will be divided between the whole same mesh of complex numbers (every point of this image represents a complex number and the output of the test is the division of each one of those complex numbers by all the complex numbers of the mesh)

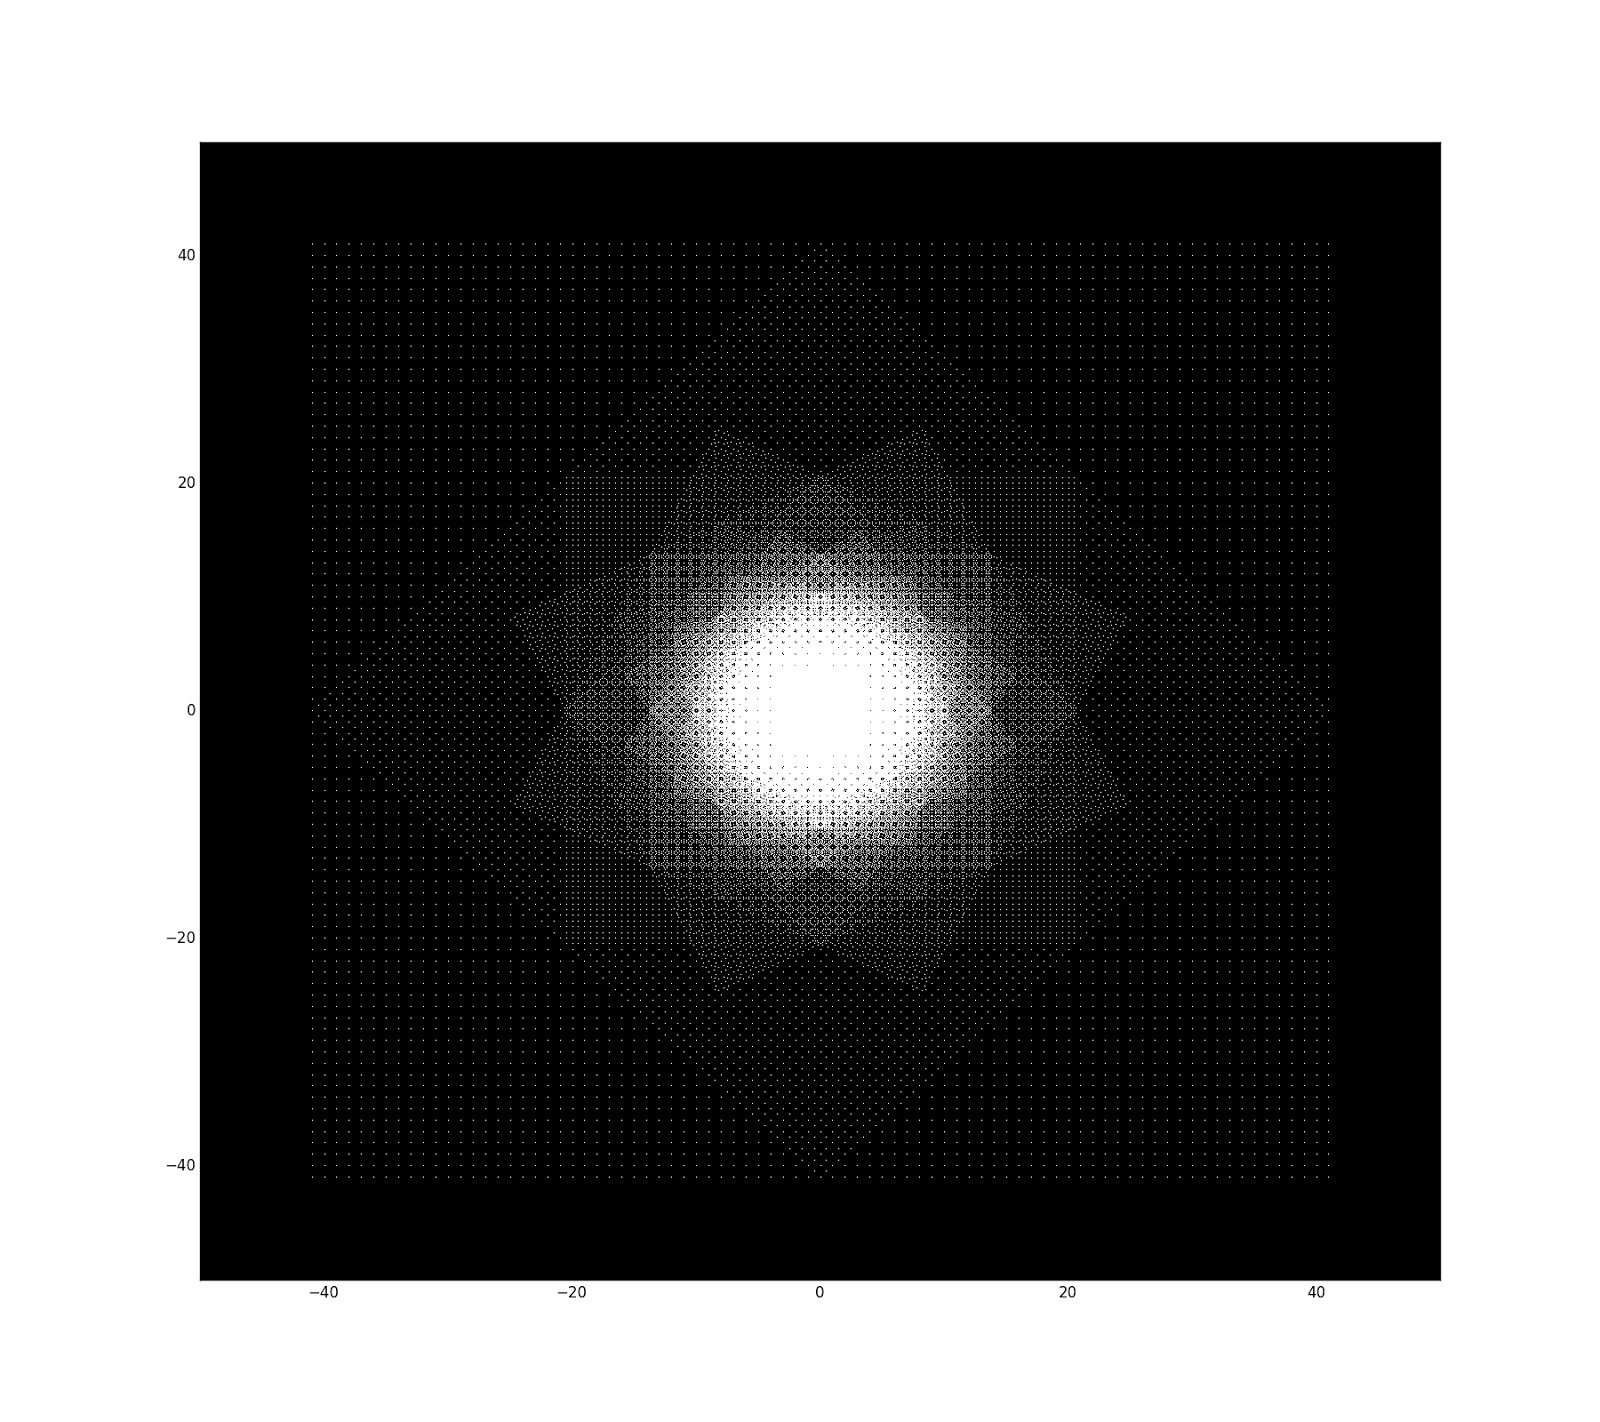
3. This is a zoom-out to see the result of the complex division. This is the complete set S seen from the interval x=y=[-50,50]. As it can be seen in the image, due to the complex division formula, different meshes representing different subsets of the complex division are generated rotating on the center 0+0i. Up to the interval x=y=[-1..1], the closer we are to the center, the more different meshes are swapped, and the denser it is the quantity of complex numbers of the set. For smaller intervals inside x=y=[-1..1] (e.g. x=y=[-0.5,0.5]) the closer we get to the center (I will call it nucleus too) the darker it gets. The peak of density is at x=y=[-1..1], so the image is brighter when it is zoomed on that interval. Clicking in the image it is possible to see details on the structures that are generated due to the swapping of the meshes. They are similar to tessellations.
4. This is a zoom-in in the frame x,y in [-1.2,1.2]. There is symmetry in both axis, X and Y.

5. Zooming-in even more, it is possible to see how it looks like the nucleus near 0+0i, this is x,y in [-0.1,0.1]. The more meshes are swapped the more interesting patterns appear. The image below is obtained by using the intervals A=B=[-81..81] instead of A=B=[-41..41] because the closer we get into the center inside x=y=[-1..1] the darker it is, so it is required a bigger set S to have more density and bright (so the pattern closer to the nucleus is easier to see).

Summarizing, the following video shows a zoom-in, zoom-out into the patterns that can be seen in the set
of complex numbers obtained from the divisions of the complex numbers:
z1/z2 , where z1 = (A+Ai) and z2 = (B+Bi) where A and B are natural
numbers in the interval [-41..41]. The set generates all the possible
combinations of divisions between z1 and z2 in those intervals.
So far those are the results of the test. Now, what similarities can be found between those images and the refraction patterns of quasicrystals? Let us compare.
1. Something basic, credits to the Wikipedia, this is the X-ray diffraction pattern of the natural Al63Cu24Fe13 quasicrystal.

2. Credits to Steffen Weber, this is a simulation of diffraction pattern, which could represent either electron diffraction patterns or the zeroth layers of precession photographs (X-ray), dodecagonal QC:

The pattern above looks similar to the zoom-in in the pattern of the complex division for the interval x=y=[-1..1]. I suspect that the complex division produces those patterns due to a n-fold rotational symmetry. See here for more information too.
3. Credits to Damian OHara. More refraction patterns:

4. In this link there is a very good technical description of the refraction patterns. And in this link there are more examples of n-fold symmetries. In this one there are similar star-like patterns as the ones I found at the roots of quadratic equations.
So far this is all I have found. I will try to look for more information, but at least the similarities are quite interesting.
I would like to finish this post with two of the best videos I found about quasicrystal, tesselations and tiling. The first one is from Sir Roger Penrose, "Forbidden crystal symmetry in mathematics and architecture".
And my favorite one! Professor Marjorie Senechal, "Quasicrystals Gifts to Mathematics":
Please if somebody reading this knows more about the subject let me know, I would like to learn more about it.
https://phys.org/news/2018-09-hidden-prime-crystal-like-materials.html
ReplyDelete